
The Commute Project, uses myself as data set to investigate and attempt to concretize the everyday in-car experience of Los Angeles commutes and commuters.
According to the 2010 City of Los Angeles Transportation Profile, nearly 80% of all commuters in Los Angeles commute by automobile. To the Los Angeles Department of Transportation, these commuters and their commuters are represented as data sets of average times and distances. However, these data sets do not reflect the conditions that drivers encounter during the vast expanses of time spent in their 1-3 ton metal-and-plastic boxes or the experience of hurtling down the asphalt and concrete at breakneck speed or alternatively crawling along at snail-rivaling paces. Time and distance fail to describe the emotional, mental, and physical toll on the driver of those daily commutes. They also do not reflect the motivation for risking life and limb, five days a week, in a city with 10% of the nation’s vehicular fatalities.
Being a Los Angeles County native, I have spent approximately 1,715 hours commuting 79,017 miles over a span of 67.25 months. From 2008 to 2010, I had a set of particularly grueling commutes that regularly included dodging road debris, sitting in traffic directly beside cars on fire, witnessing and avoiding vehicular collisions, and sitting through traffic that left me physically and mentally exhausted. In 2010, I began to collect and map data during my commutes, analyze my decision making processes while driving, and recall events of significance that I have witnessed during my commutes. The result of this data, analysis, and self-reflection is, Approximately One Thousand Seven Hundred Fifteen Hours and Counting, that uses myself as data set to investigate and attempt to concretize the everyday in-car experience of Los Angeles commutes and commuters.
GPS Sculptures
The 3D prints are based off GPS data collected from my commutes to and from work, including elevation, latitude, longitude and speed information. This information is processed with an application written in Processing that parses the logged GPX data and maps the various data points into a 3D mesh. Latitude and longitude are mapped to the x and y-axis, elevation to the z-axis, and speed determining the width of the mesh, with higher speeds resulting in a thinner profile and slower ones resulting in a wider profile. The mesh is then printed using a SLS-based 3D printing process, with the resulting form having a sharp geometric form with semi-transparent walls that allow light transfer. These GPS prints are illuminated by pico projectors that project a sweep of color that gradually passes over the model in accordance with the duration of the given commute. Each print has a corresponding set of commute-specific audio, comprised of surround sound field recordings from within the car’s cabin and narration of events witnessed during these commutes and stratagems for navigating the specific traffic and road conditions.

The 3D prints will then have points backlit with LEDs or projection that correspond to points of interest that will be combined with audio narration of the route.
3D-Stereoscopic Live Action & Surround Sound
Each commute is documented with a stereoscopic camera rig and recorded in 5.1 surround sound, in an attempt to capture the drivers experience behind the wheel. The videos contain no cuts and capture the full durations of the commutes. Currently three commutes have been shot and are in the process of being graded. Below is a short 3D stereoscopic test that takes place on Los Angeles’ “Dead Man’s Curve” on Sunset Blvd.
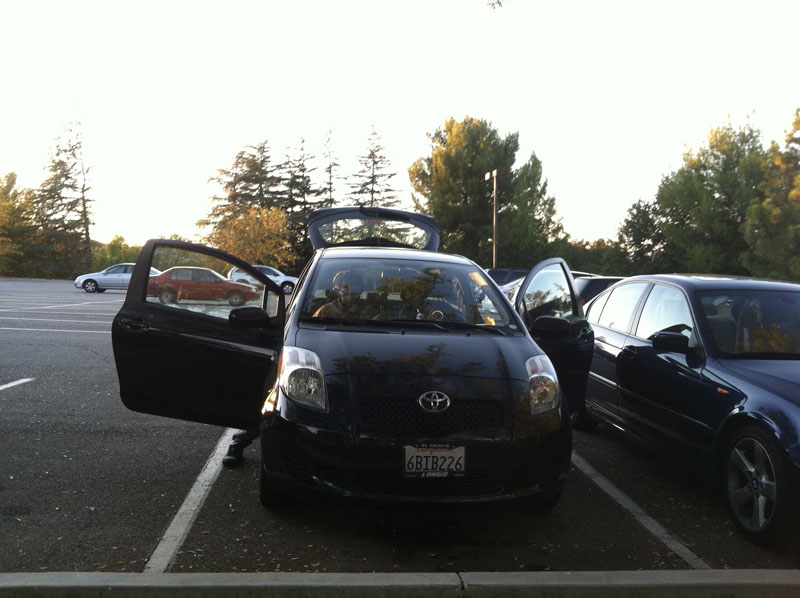
Documentation of Vehicle Rigged with 3D Stereoscopic Camera and 5.1 Surround Recording Setup


Driver Input and Environment Tracking
The driver of a vehicle makes countless decisions during every commute that contribute to the mental state of the driver. This can include things such as usage of the pedals, gear shifts, and turn signals. In addition cabin environment and road conditions also contribute to the driver’s state. Currently a set of low-cost sensors are being tested to record this data. The final data set will likely include gear shifts, pedal usage, pedal pressure, turn signals, cabin temperature, lateral acceleration, shock, and impact forces.
Below is an early example of tracking gear shifts with a color tracking application written in Processing. The application uses pre-recorded video footage that color tracked to determine what gear the shifter is in.


